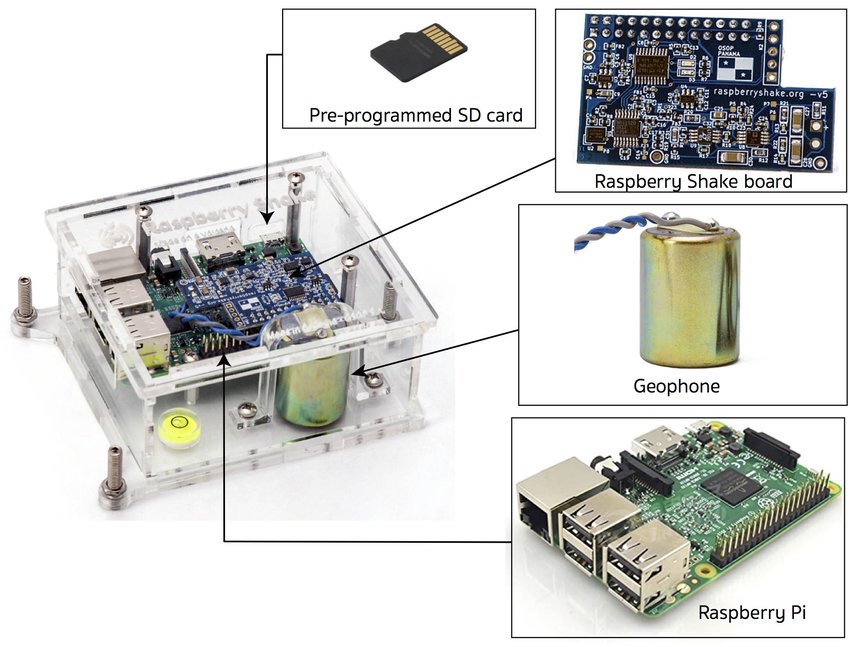

A Raspberry Shake is a compact professional grade that records seismic activity. They are designed for both educational and scientific purposes, making it possible for schools, hobbyists, and professionals to monitor and study earthquakes and other ground vibrations. The reason they are named ‘Raspberry Shake’ is they utilise the power of a Raspberry Pi computer to detect and record seismic activity.

Source: Subedi, Shiba. (2020). Seismology at school in Nepal: Building an operational low-cost seismic network to establish an educational seismology program. 10.13140/RG.2.2.36498.07360.
See below our Raspberry Shake Setup Guide. This provides step by step instructions of how to set up a Raspberry Shake seismometer in your home. Please note if you are setting a shake up in your school we advise contacting your IT administrator.
You can see Raspberry Shakes FAQ page here.
This video is a guide of how to navigate Raspberry Shake’s Station View website and a quick overview of the Data View website. You do not need to own a Raspberry Shake in order to use the website. You can access the Station View website here.
Raspberry Shake ran an excellent webinar called ‘What’s that wiggle? This video is a guide by Branden Christensen of how to navigate Raspberry Shake’s Data View website. You do not need to own a Raspberry Shake in order to use the website. This video is very useful to help distinguish what is noise and what is actually an earthquake. You can access the Data View website here.
The following are timestamps from this video. You can skip to specific sections if you don’t want to watch the entire video. You can also increase the playback speed on YouTube. You can watch this video on Raspberry Shake’s YouTube channel here.
6:30 – Branden starts talking
9:40 – Begins talking about Station View
12:43 – Opens Data view
19:10 – Signal from a washing machine/mechanical noise
21:00 – Helicopter signal – Doppler effect and another washing machine example
24:07 – Looks at earthquake swarm from Iceland. P and S wave
27:20 – Changes the scale and filters
28: 25 – Looking at the spectrogram earthquake signal
31:15 – Costa Rica example and label on date view spectrogram looking at a regional earthquake. Lower frequency signal.
34:15 – Tell-tale signs it’s an earthquake. Diamond shape is usually noise. Difference between noise and an actual earthquake.
39:00 – Looks at Japan station and regional earthquake recorded
from ~100-200km away from station.
43:00 – Looks at Japan M7.5 Noto Earthquake
44:36 – M7.5 Noto Japanese earthquake recorded on a Scottish Station
47:30 – Applies global filter and low frequency custom filter 0.001 Hz-0.1 Hz Can see ringing from the earthquake.
49:47 – Questions from Audience. Gary asks about a line with a constant frequency which is something mechanical.
52: 55 – Using AI to identify earthquakes.
54:50 John asks about Gaps in the data.
58:00 David asks about triangulation for Raspberry Shake booms?
1:01:13 – Randy looking at noise, within his data. Branden suggests looking for interesting signals in big spectrograms instead of small sections.
1:07:00 – Pete asks about successive arrivals of waves in the Scottish Station data.